The old saying goes a picture is worth 1,000 words. The advent of infographics has definitely proven this theory to be true. Since 2012, more website owners have tapped into the power of marketing with infographics. You can also take advantage of this form of communication while watching your online audience grow.
What Exactly Are Infographics?
They are colorful displays of numbers, percentages, dates and other statistics combined with pictures, clip art, cartoons, charts or images. However, this artistic presentation tells more of a story than just tables or pie charts.
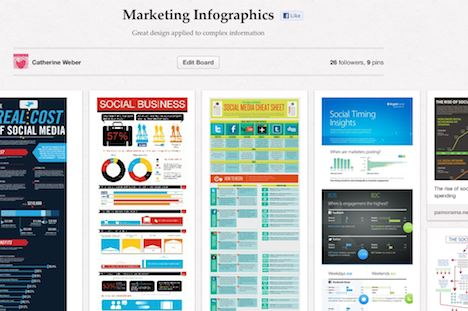
To make them work, you have to incorporate text in just the right way and use as few words as possible. For high-quality examples, you can look at ones posted on Facebook, Pinterest, Instagram or other image sharing sites.
Infographics Versus Large Blocks of Text
When your audience just needs numbers and percentages, you can provide a visual display to keep them interested. After all, they came to your site for facts and don’t care about long, boring details.
However, this doesn’t mean that displaying huge blocks of text without images does not provide some value. Sometimes people need more information than a picture or image can provide.
On the other hand, a more artistic-looking display catches the eye of readers who don’t have the time to scroll down the page of lengthy blog posts. Providing them with priority data they can quickly view helps if they don’t have the patience or time to read a long report.
Yet, they can obtain facts they need for any research project. Your numbers arranged in an attractive manner also convinces them of your authority on a subject. At the same time, you can reach them at a basic level. Data laid out just right could educate a person of any age about any issue that pertains to them.
Numbers and text creatively placed in just the right design also helps your readers view content faster than in slideshow or video examples. Whatever they need to know is right there and they don’t have to click on extra pages to see more. Use the data to create a unique image and tell an interesting story.
Short History of Information Graphics
The necessity of this media increased once search engines started valuing visual displays as much as they cherish high-quality text. However, the benefit progressed far beyond changes in SEO algorithms. Now this method of data reporting combines ordinary statistics with social interaction to send a clear message to readers.
What to Expect From Infographics
According to Brafton, images in content increase audience click-through rates by 47 percent. Attractive visual displays also cause people to be 80 percent more willing to read website text.
However, website owners need a reason to display the facts. Otherwise, no one will know why they should even care about the statistics presented on a page.
How to use your creative works of art to entice site visitors:
- Keep it local and relevant.
This will help you reach potential customers who live near you and are located within your community. It will also improve the chance that they will care about what you have to say.
- Whenever possible, use comparisons.
This helps your audience decide for themselves what to believe, what choice to make or what they should do about it.
- Make sure it pertains to the content it promotes.
For example, a website about automobile safety, generally, should not post on the number of women over 40 who have their first child. Of course, the only exception is when the writer has tied this statistic into the website topic.
- Do not post strings of unrelated visual displays on a single website.
If you want to create a multi-topic website or blog, you can. However, if you just post random entries and your blog is disorganized, no one will be able to find information on specific topics.
- Stick to what your audience wants to know.
Check out trending topics to help you decide what to write. You can also use keyword targeting to direct your content to the right audience.
As the Internet becomes more competitive, the need for visualizations will increase, especially if you promote any kind of advanced programs or services that could be better described through a series of images or a solid infographic. Infographics help you relay your message to your customers or audience in a clear, concise way that can be much easier for them to follow.
This post was written by Jeff Shjarback. Jeff Shjarback, MBA is a Digital Marketing Consultant, Writer and Blogger that enjoys blogging about online marketing, small business, lead generation, economics, innovation & emerging technology, future trend analysis and business philosophy. To learn more about Jeff, you can visit his Google Author Profile.